

Is the trend your friend if you're vaxxed?
Is the trend your friend if you're vaxxed?
Maybe not.

There is a well known saying in financial markets, “the trend is your friend.” Of course the trend can also be your enemy if it goes against you.
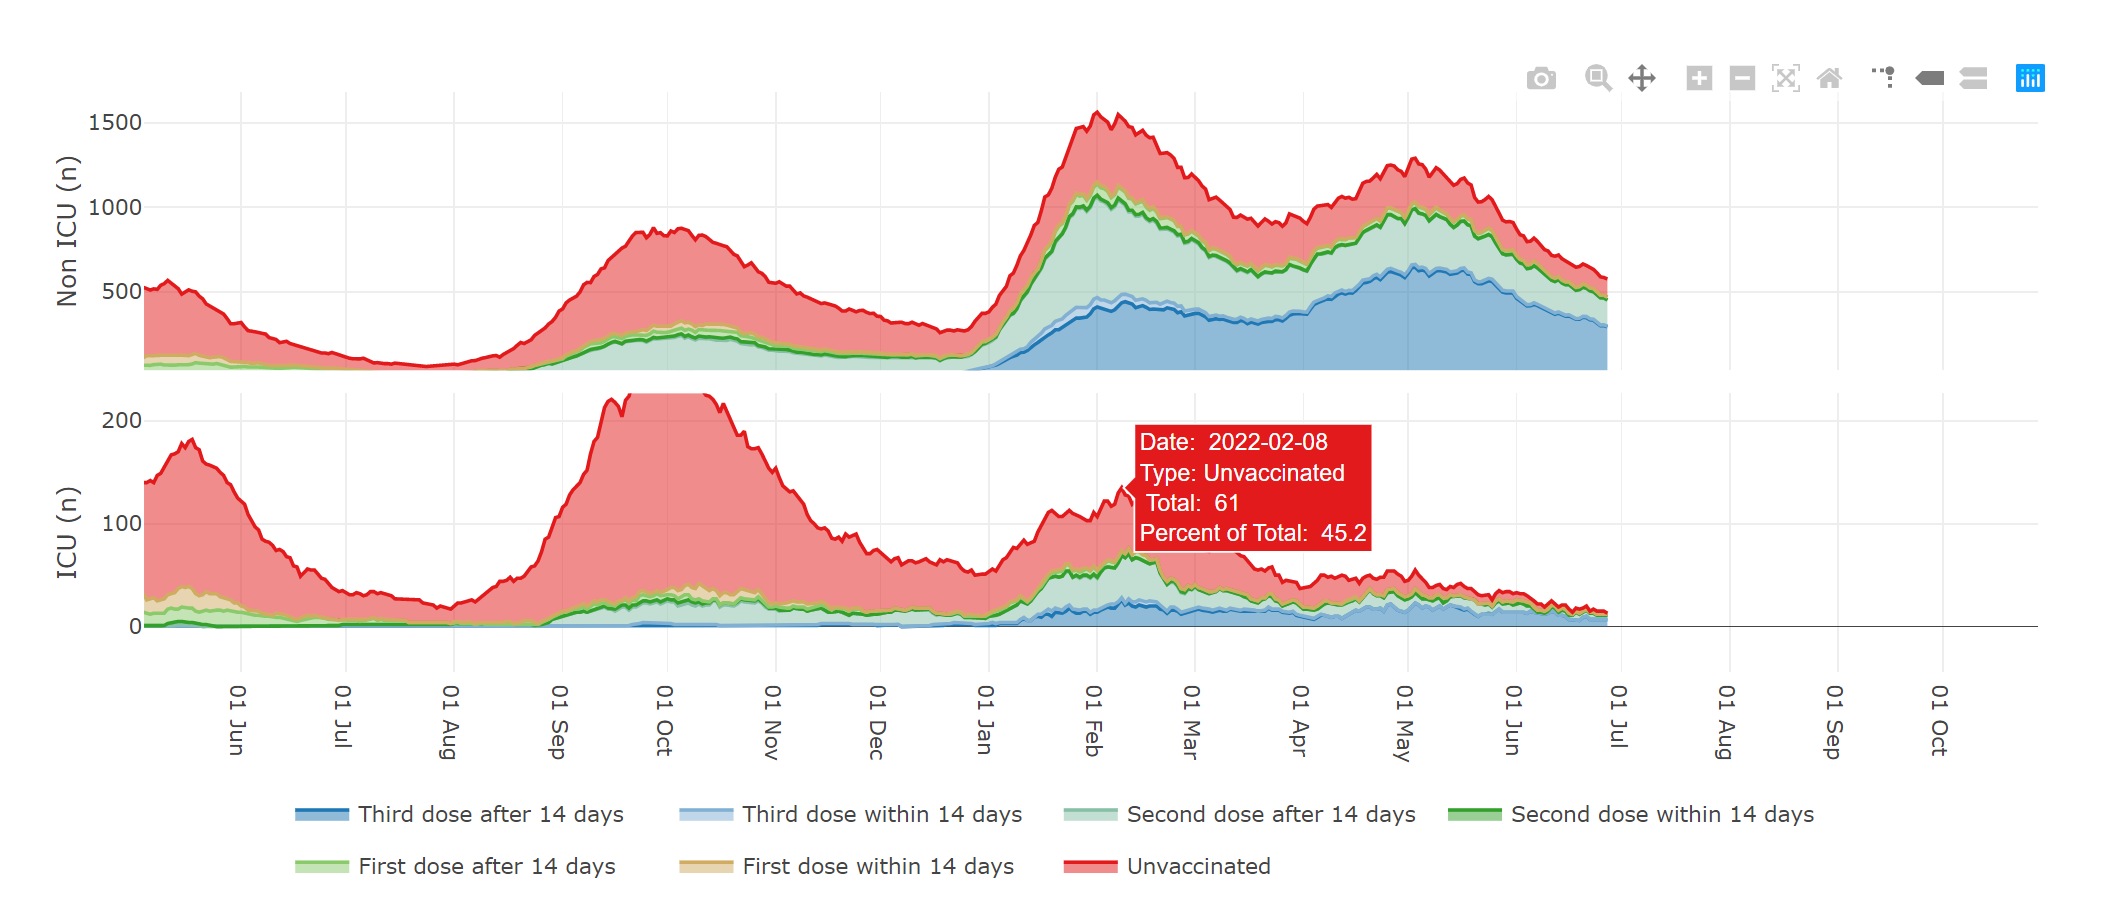
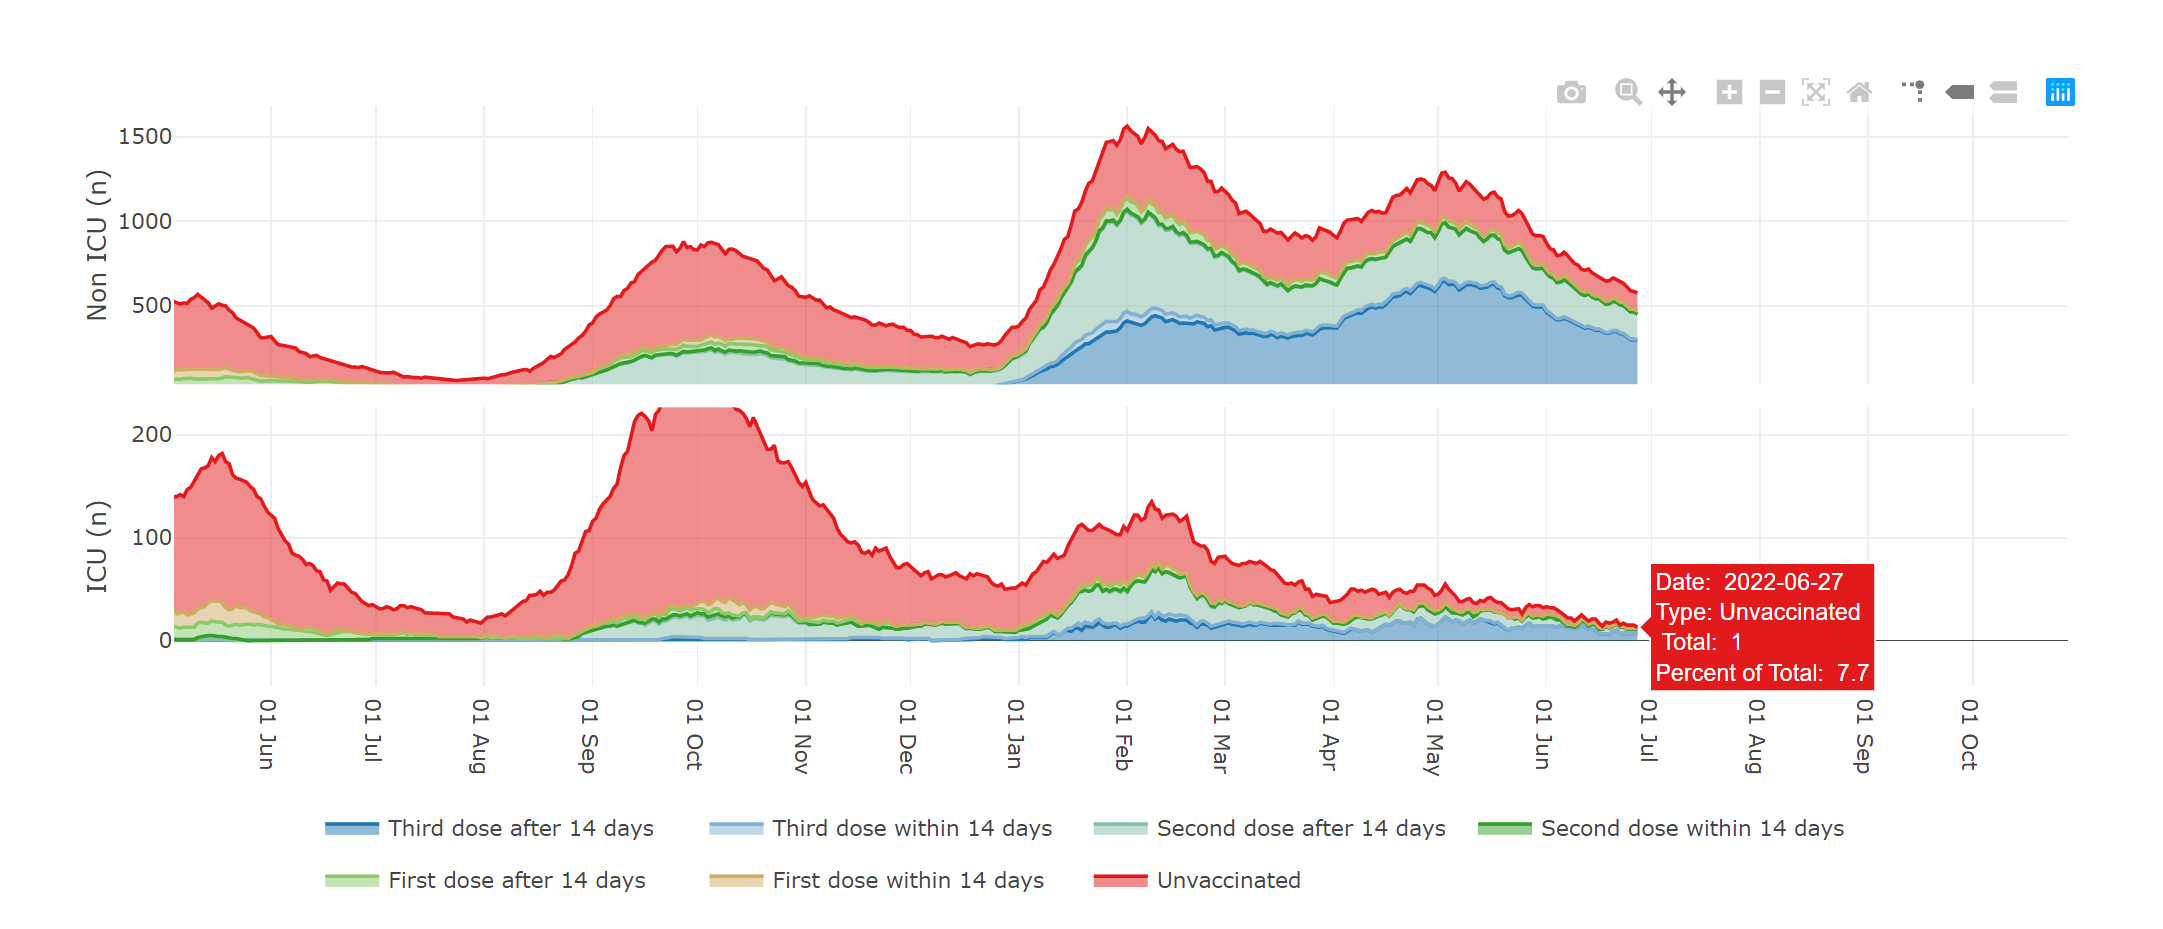
The two charts below are from the COVID-19 “Vaccine Outcomes” data provided by the Government of Alberta showing Hospital and ICU patient counts over time. The first chart shows that on February 2 (this year’s peak) 45.2% of ICU patients were unvaccinated. The second shows that as per the most recent report only 7.7% of ICU patients were unvaccinated. This means that although the overall number of ICU patients has decreased significantly the percentage of ICU patients that are unvaccinated has also trended downwards significantly.
The chart further below is from the UK Government’s Coronavirus Dashboard showing the number of initial COVID infections versus reinfections over time. This chart shows that six months ago reinfections were equal to approximately 10% of initial infections. Over time this relative percentage has slowly but steadily crept up. The most recently reported data shows that reinfections are now equal to approximately 20% of initial infections. This means that while the overall total of infections (cases) has decreased the relative percentage of people experiencing reinfections has trended upward to double that of six months ago.

What would be really interesting to know is the percentage of reinfections that are occurring in the unvaccinated. Unfortunately this isn’t included in the UK reporting and to date I have not been able to find any data that shows reinfections by vaccination status.
So, is the trend your friend if you’re vaccinated?
"Normalized" data is always more meaningful... eg ICU patients per 1 million vaccinated people vs ICU patients per 1 million unvaccinated people. Otherwise the low 7.7% unvaccinated could be largely because there are so few unvaccinated people. So if you could account for the denominator for your future analysis that would be great. Thanks for the info though.