

An update on UK reinfection trends
An update on UK reinfection trends
Is this a good sign?

We know that the immune response from the COVID “vaccines” is non-sterilizing (i.e. it doesn’t totally prevent infection). We also know that as with other coronaviruses people can be reinfected. I’ve seen reports of both Vaxxed and Unvaxxed experiencing reinfections but lack of data by Vax status makes it difficult to accurately assess a relative incidence.
I’ve posted in the past on this topic using data from the UK which is one of the few publicly available sources of reinfection data. Admittedly there are confounding factors such as Reinfections being counted as First Infections if they occur after a certain period of time and lack of testing on people who are infected/reinfected but have only minor or no symptoms. Both of these factors have the potential to obfuscate the actual incidence of reinfections but this data seems to be about as good as it gets at the moment so for now it will have to do. For the UK data the timing criteria for infections being deemed Reinfections or First Infections is as follows (emphasis mine):
COVID-19 cases are identified by taking specimens from people and testing them for the SARS-CoV-2 virus. If the test is positive, this is a case. Some positive rapid lateral flow test results are confirmed with lab-based polymerase chain reaction (PCR) tests taken within 72 hours. If the PCR test results are negative, these are not reported as confirmed cases.
People who test positive again after a given time period are counted as new cases. In England, Northern Ireland and Scotland people are counted as new cases if they test positive again more than 90 days after their last positive test. In Wales, a period of 42 days from a person’s first positive test in an episode is used.
If a lot of people are experiencing reinfections but are not getting tested or if the average time between reinfections is greater that 90 days this data will not be revealing anything close to an accurate picture. From my way of thinking a reinfection is a reinfection and it shouldn’t matter what the interval is but that’s just me and again this is all we’ve got to work with. So, keeping these limitations in mind, what is the data currently showing? In the past I have reported on the ratio of reinfections to first infections and how the ratio was increasing over time. For this post I thought we’d first take a look at Daily Total Infections to see what the overall trend looks like and then look at Reinfections versus First Infections to see how those two trends compare.
Here’s what the trend for Daily Total Infections looks like from August 6, 2022 to March 4, 2023:
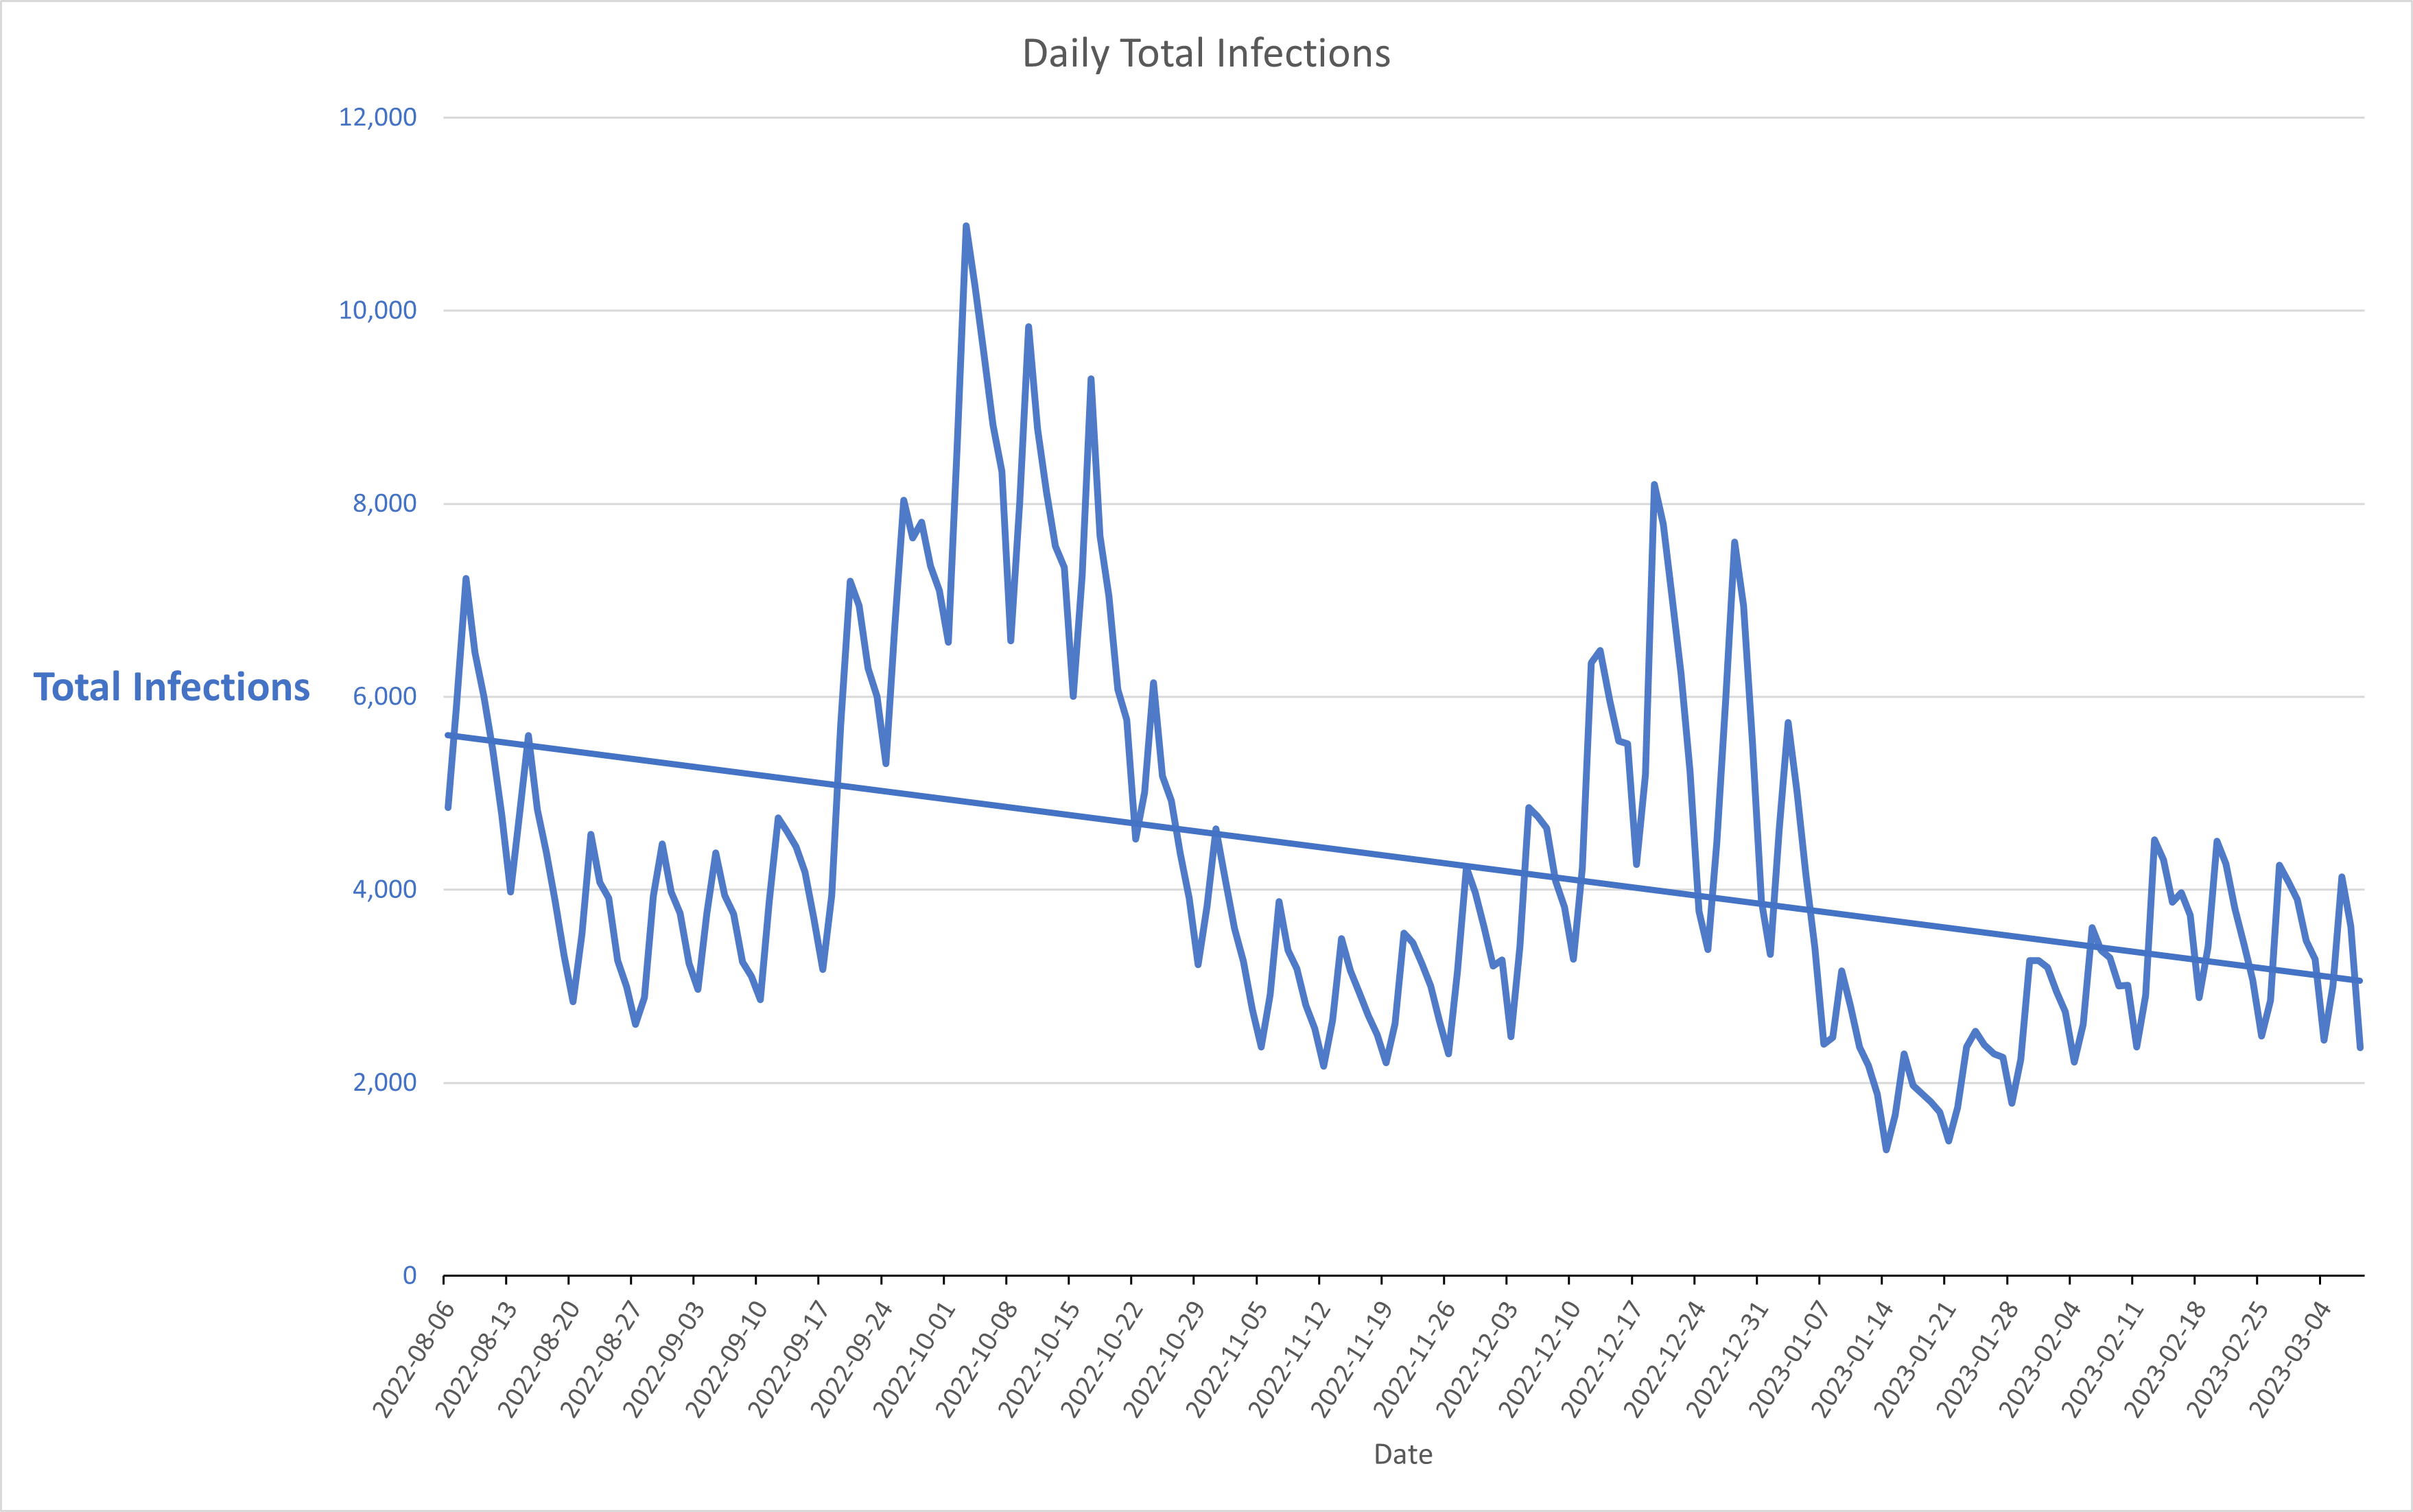
As you can see from the graph the trend for Daily Total Infections is clearly in decline which would seem to be good news.
Below is a graph of Daily Reinfections versus Daily Total Infections from August 6, 2022 until March 4, 2023 with trend lines for each.

You can see from this graph that the trendline for Reinfections is in a slight decline whereas the trendline for First Infections is in a fairly strong decline. As time goes by the pool of potential First Infections decreases (although this may not actually be the case given the timing criteria noted previously) which adds to the pool of potential Reinfections so a slower decline in Reinfections would make sense even if Reinfections were on a similar overall decline to First Infections. Thus the key concern would seem to me to be what happens with the Reinfections trend going forward. If both these trends continue down then that would seem to be a good news story all around. If however First Infections bottom out (don’t go to zero) or Reinfections stay steady or rise that to me would be worrisome. I will continue to monitor with the intention of providing a subsequent update in the near future.
Of course a big overarching question to all of this is what percentage of the reinfections are Vaxxed? That information is not being shared publicly so if anyone can help answer this question that would be most appreciated!
Thanks as always for your feedback.
John
That's quite an interesting second graph. Those reinfection numbers aren't that promising imo. It doesn't feel like a very fast decline. Yes, it's a negative trend line but how much did it drop over that year? Looks to me like five percent eyeballing. At that rate covid would linger around for two decades.... Potentially doing more rounds of damage.
Here is a good sign: Matt Hancock, one of the most infectious people in UK health, is called for his arrest by MSM.
https://www.frontnieuws.com/eerste-dominosteen-is-gevallen-msm-roept-op-tot-de-arrestatie-en-vervolging-van-de-britse-minister-van-volksgezondheid-voor-covid-misdaden/
Set to English. He would be the person to ask your questions? :)